By Robert J. Strachota, MAI, MCBA, CRE®
Note: The following article is a presentation given by Shenehon President Robert Strachota at the Minneapolis Business Law Institute on May 2, 2016.
I am Bob Strachota, president of Shenehon Company, which appraises businesses and commercial real estate throughout Minnesota and more than 40 other states. We know the pulse of the Minnesota business climate and are in tune with market expectations of the near future.
Today, we will discuss the condition of the Minnesota business climate for commercial and residential real estate, and the general level of profitability for small and large businesses in our state.
The Minnesota business climate has two major tiers: the 16-county Twin Cities metropolitan area, and the outstate Minnesota market. Rochester is an exception: an outstate city that behaves differently than all other outstate cities because of the effect of the Mayo Clinic. Nonetheless, we will keep Rochester in the outstate category because it is not nearly as strong as the 16-county metro area.
The general health of the Twin Cities market is positive, and the prognosis is for a continued upward trend. The healthy growth curve has not reached the crest of the wave or the high point of a business cycle. The same applies for the outstate market, but the size of the wave is much smaller.
How do we know this? We typically focus on 6 critical community characteristics when sizing up the economic health of a market. They are:
- Unemployment rate
- Average wage level
- Average age of population
- Population growth
- Employer and labor force data (new jobs)
- Education level of workforce
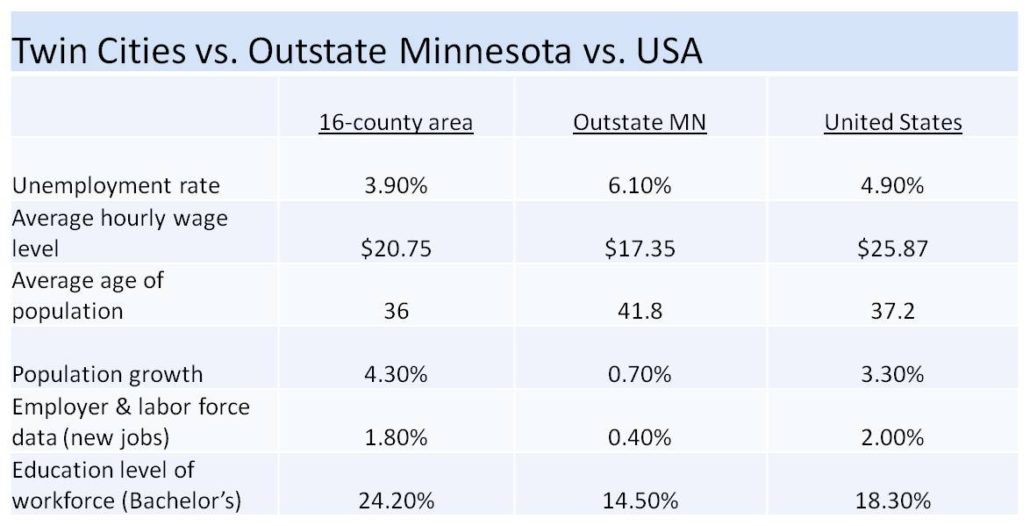
Characteristics gauging economic health in Twin Cities 16-county area:
- Unemployment rate: 3.9%
- Average wage level: $20.75/hour
- Average age of population: 36.0
- Population growth: 4.3% from 2010 to 2015
- Employer and labor force data (new jobs): 1.8%
- Education level of workforce: 24.2% with Bachelor’s degree
Characteristics gauging economic health in outstate Minnesota:
- Unemployment: 6.1% (up two-tenths over last year)
- Average wage level: $17.35/hour
- Average age of population: 41.8
- Population growth: 0.7% from 2010 to 2015
- Employer and labor force data (new jobs): 0.4%
- Education level of workforce: 14.5% with Bachelor’s degree
Comparing the 16-county metro area and the outstate statistics with statistics for the United States at large underscores the strength of the Minnesota market.
By analyzing data like this, we conclude that the Minnesota economy remains in an ongoing expansion, particularly in the 16-county metro area. As this recovery matures, inflation, high interest rates, and cost-push will tamp down the expansion. The risk of a Minnesota recession in the near term is low, and it does not appear that the recovery will be ending anytime soon.
Why? Well, for one, the Minnesota economy is highly diversified. This is one of its strengths. Of the various market sectors, the energy industry was the only one that was a strong component of the recovery but has now sharply corrected. A handful of Minnesota companies took it on the chin when oil prices plummeted. The energy industry appears to be refreshing itself in recent weeks and may have already bottomed out.
Currently, there are no storm clouds on the horizon for the Minnesota economy. These would appear if the economy showed evidence of “excesses” by consumers or businesses. On the consumer side, there is little evidence of excessive spending and, in fact, the household savings rate has risen to near record levels in Minnesota. Furthermore, household net worth is approaching record levels. As a result, household debt service ratios are near record lows.
As for businesses, we do not see the kinds of excesses that typically reveal themselves ahead of a recession. Instead, we observe that most businesses are not overstaffed, and their capital spending has not been overdone. Average factory utilization rates have not exceeded 80%. The housing industry has not boomed out of control, and consumer confidence has been timid. And, lastly, excessive lending and overbuying is not evident in the marketplace.

Business has been good for most Minnesota companies. For 2015, the top 75 public companies operating in the state reported a combined increase of profit of over 5% from the previous year. This includes the energy-related companies that lost over $2 billion. The total revenue for these 75 companies was over $512 billion, which tops every year since 2004. Fifty of the companies on the list posted higher revenues than they did in 2014.
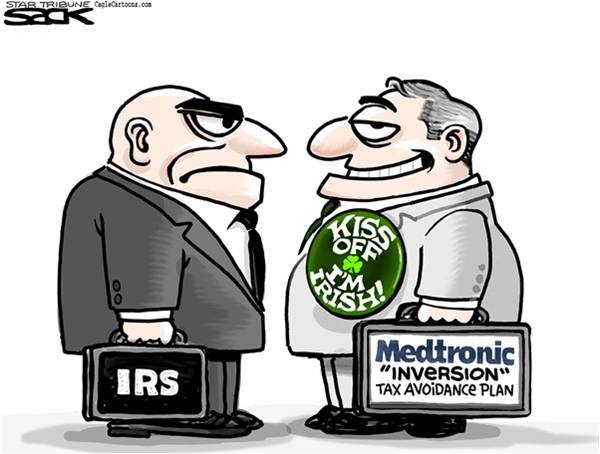
These are impressive results, but there is one statistic that we need to be aware of. The list we could previously study was called the Top 100 Public Companies. A major reason for the list shrinking is that fewer companies are choosing to be headquartered in Minnesota. The trend is downward, but diagnosing the severity of the problem is difficult.
At Shenehon, we also appraise many private companies. This gives us access to financial information that is not public. Right now, the patterns of success we have just reviewed for public companies are mirrored in the private sector.
For small businesses specifically, we conduct valuations for federal government Small Business Administration (SBA) loans, and we can report that small businesses are opening up at record levels, creating new jobs and becoming profitable on timely schedules.
So how does the current state of the Minnesota economy affect real estate asset values? Let’s study this by submarkets, which are residential, retail, office and industrial.
RESIDENTIAL
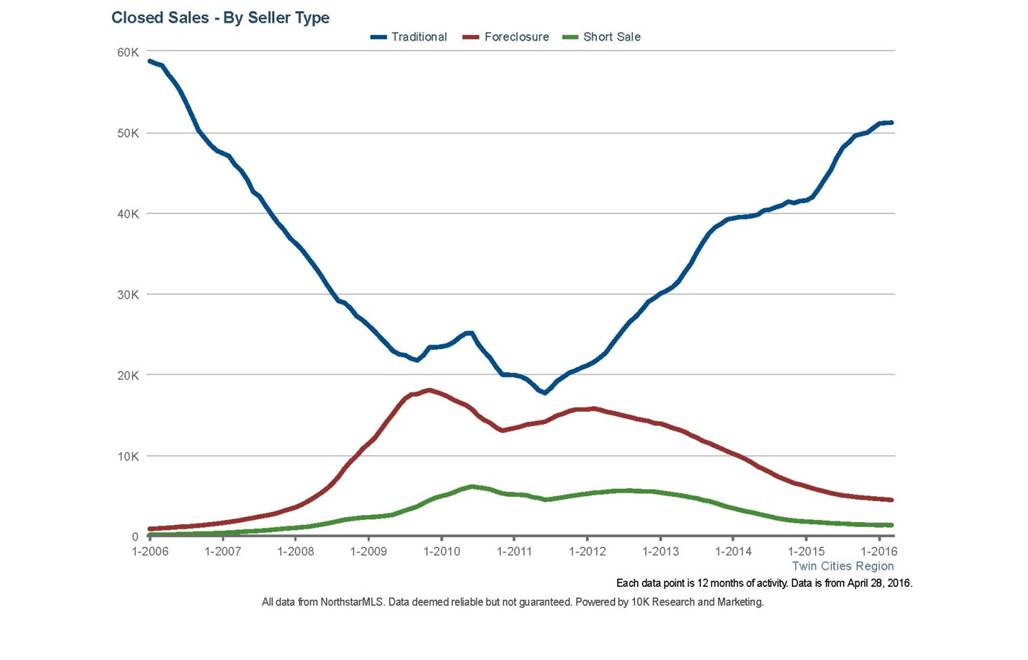
The residential submarket has to be subdivided further into single-family homes and apartment rental housing. The single-family home market in the 16-county metro area has been strong and will continue to get stronger. Short sales and foreclosures no longer dominate the market and have fallen back to historical norms.
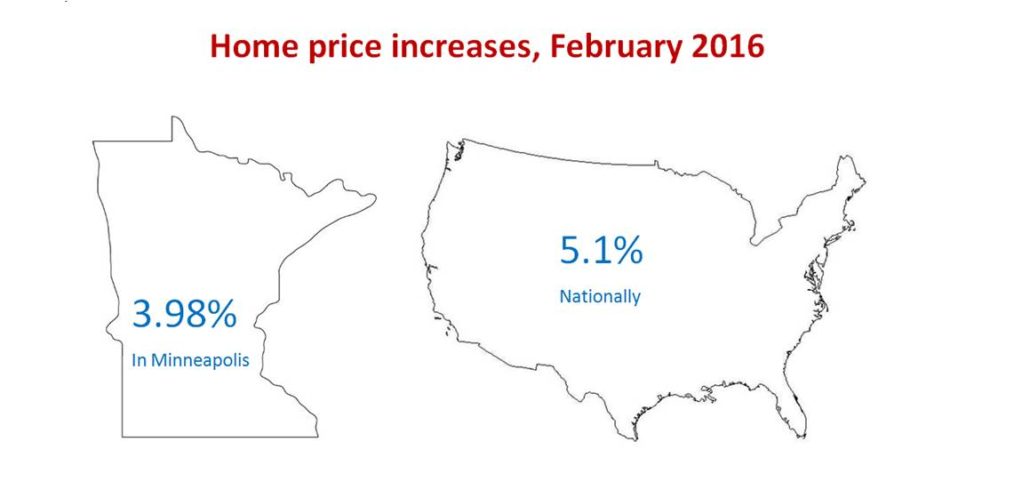
The traditional home sale transaction dominates the market; both in the metro area as well as most outstate markets. Average home prices throughout Minneapolis rose 3.98% in February 2016, compared to a national average increase of 5.1%.
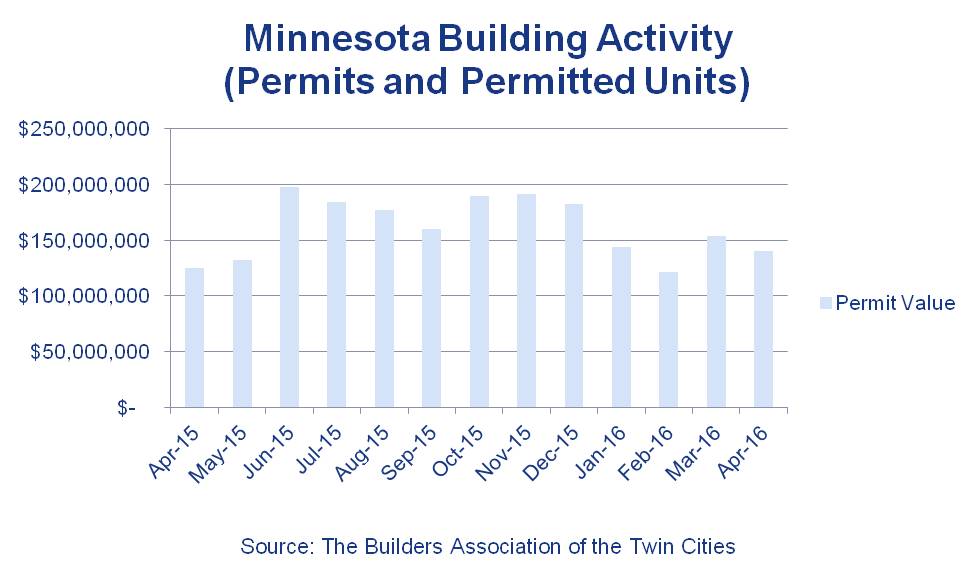
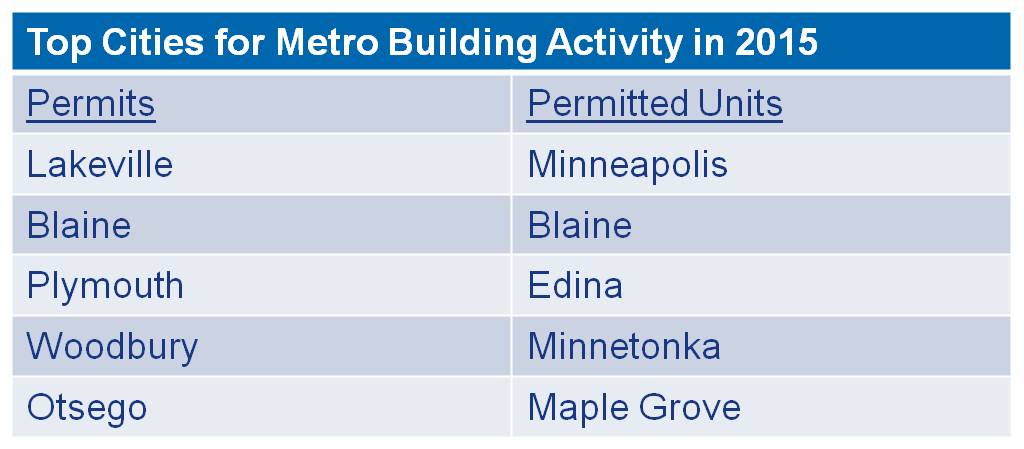
New housing starts are steady and nearly fully restored to historical levels. The top cities in the metro area for new housing permits are shown in this next exhibit, with Lakeville leading in dollar value of permitted units, and Minneapolis leading in number of housing units.
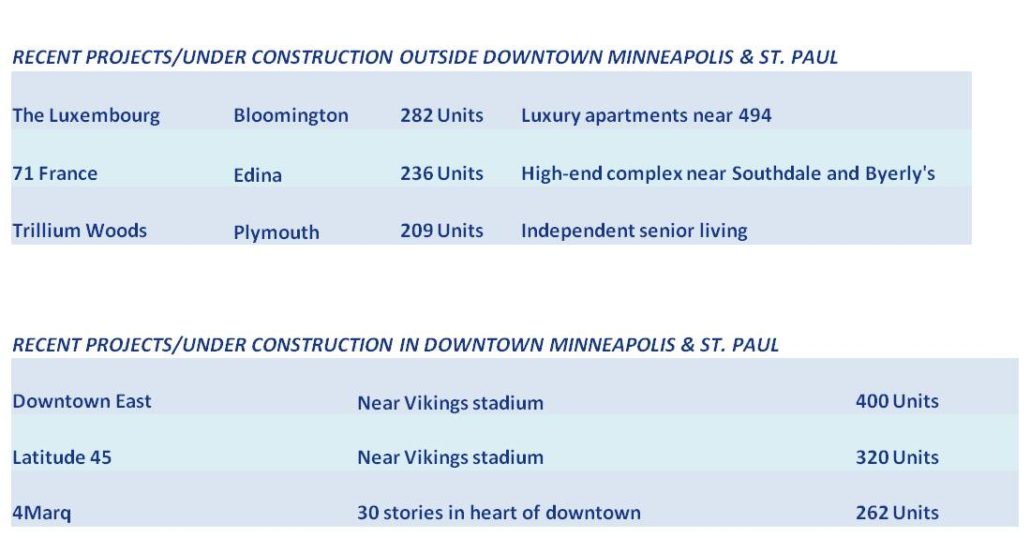
The apartment market is expanding at a record pace, with apartment projects planned throughout the metro area. Outstate, we have over 1,000 new units planned in Rochester, coinciding with the Mayo expansion, and Duluth is way up as well – five developers have announced plans for a total of 577 new units planned for next year.
RENTS AND VACANCIES
Rents continue to rise, and vacancies have shrunk to abnormally low levels. Exhibit H shows average rents and vacancy levels in various areas in the 16-county metro area and certain outstate markets.
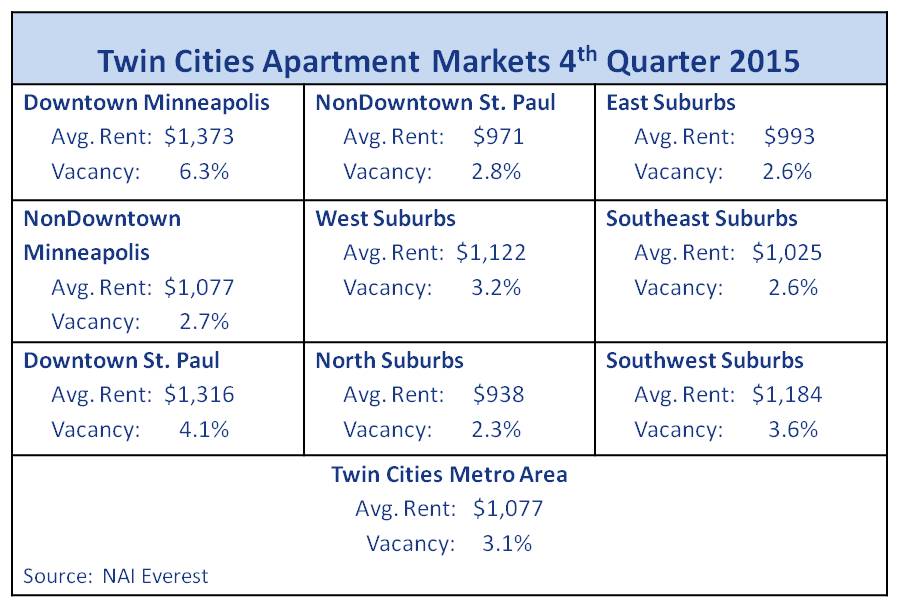

There are two reasons why the rental market is so strong. First, many people lost money in the housing downturn and have chosen a different lifestyle while in recovery. Second, most young people are saddled with substantial educational debt that precludes them from buying homes, either single-family or condominiums. Many of us in the real estate industry believe the educational debt crisis will be the next financial debacle that the federal government will need to fix to return normality to the single-family home ownership market.

RETAIL
Bolstered by a relatively modest rate of increasing personal income levels and lower fuel prices, demand in the national retail market outpaced supply during all of 2015. Demand for available retail space in the neighborhood community segment was particularly strong during the year.
The average vacancy rate in the national retail market trended downward another 20 basis points in 2015, declining to the low 10% range. The national average net asking rates increased 2% during 2015.
The first quarter of 2016 marked the fifth consecutive quarter of positive net absorption in the Twin Cities market. Across all Twin Cities submarkets the 1st quarter vacancy rate sits at a mere 6.0% and average net asking rental rates are $15.66/sf.
The Minneapolis/St. Paul market experienced a moderate decline in asking rents during the first quarter of 2016. However, due to the number of new retailers and new restaurants entering the market, demand is expected to cause rents to increase in most submarkets. Market value of retail space has remained constant over the past year, but has now surpassed the all-time highs from before the real estate recession.
Let’s move onto the office market.
OFFICE
Overall the office market has been affected by somewhat slower job growth, increased financial market volatility, and a marked slowdown in the tech sector. These influences contributed to a deceleration in the demand for office space in the first quarter of 2016. During that time, the average rent in 87 metro markets in the US was $28.50/sf. That was up 4.3% from the prior year.
Overall, vacancy throughout the United States is 13.5% in the office sector. Current vacancy in the Twin Cities market is slightly higher at 15.1%, however that is down 1% overall from last year at the same time. It is important to note that the vacancy for office space in the new, north warehouse loop is 6.4%, that is less than half of the national vacancy percentage and it is the tightest office market in our metro area.
In the Twin Cities, the average rent is $21.82/sf in the first quarter of 2016, which is up from $20.63/sf for a 5.8% increase from the prior year. Office values in the Central Business District, or CBD, are the strongest and have experienced an increase over the past year. The suburban office market in the Twin Cities as well as other cities has remained rather static throughout the past year.
INDUSTRIAL
Our fourth submarket is Industrial.
The manufacturing sector has improved in the first quarter of 2016. US factory activity expanded in March for the first time since last August. This is a sign that the nation’s economy is shaking off the effects of a strong dollar, depressed oil prices, and weak global growth. Current production has picked up, with factory orders rising to their highest level since November of 2014. All signs suggest there is a pickup in industrial production, yet businesses continue to work through the elevated stockpiles accumulated over the first half of 2015, when record inventories outpaced demand.
There has been progress because inventories have declined in four of the past five months, with one exception being a flat reading in December. But despite these back-to-back inventory declines, the inventory-to-sales ratio remains elevated at 1.4 percent. This suggests that businesses will need to continue to work through the inventory overhang – which is hampering manufacturing and will curb GDP growth through the first half of 2016.
The average asking rent on a national basis in the first quarter of 2016 was $5.44/sf, which is 3.8% higher than the first quarter of 2015. The United States national average of vacancy for industrial space is 6.1%, which is down from the historical average rate of 6.8% in the first quarter of 2015.
In the Twin Cities market, the overall vacancy for industrial space at the end of the first quarter of 2016 was 9.4% compared to 10.6% one year ago. The weighted average rent per square foot for industrial space in the Twin Cities market at the end of the first quarter of 2016 was $6.72/sf, which was up 6% from 2015 when it was $6.32/sf. At the end of the first quarter of 2016, approximately 900,000 square feet of positive absorption occurred in our industrial market. Over the last five quarters, the industrial market has absorbed 4.4 million square feet of space.
This is a lot of data to crunch… suffice it to say that in my professional opinion, we can conclude from these numbers that, in the Twin Cities area, the industrial market is healthy and will likely only get stronger.
During 2016, we expect to see an increase in market values or pricing of industrial space that will set new high water marks for industrial property.
Another proof point for this expectation is that the average price per square foot on a national basis increased 9.5% in 2015, which reaffirms the strength of the industrial market.
LIST OF REAL ESTATE DEVELOPMENT and BORROWING OPPORTUNITIES FOR 2016
I would like to wind down by sharing a brief listing of real estate and development opportunities for 2016.
Investment opportunities in gateway markets like the Bakken fields have come and gone. However, opportunities now exist in:
- Technology Centers. Companies are collaborating on larger facilities with enhanced security to safeguard data and confidential records.
- Neighborhood development. There is some small neighborhood development available for retail, such as coffee shops, small stores, and specialty services. Anything that starts with an “R” is a safe bet – renovation, rehabilitation, re-position, re-lease, refinance.
- Residential condominium development. Opportunities exist in spot markets, such as downtown Minneapolis, where there is an acute shortage of “for sale” condominiums. But a 10-year clawback by homeowners is a deterrent.
- Most Mixed-use urban infill development and redevelopment will be strong, if strategically located.
- Prime retirement land. Development opportunities will be back as demand for retirement homes in warm places like Florida and Arizona reignites.
BORROWING OPPORTUNITIES FOR 2016
- Last opportunities to lock down favorable long-term, fixed rate debt. Commercial mortgage-backed securities (CMBS) are back, the competition in the lending market is strong and interest rates are below long-term norms. Some owners are refinancing and leveraging up with cheap debt – in a sense, selling to themselves without paying income taxes by using non-recourse debt. But the interest rates are rising and the time is limited to lock down favorable long-term debt.
- Bargains in Downtown Minneapolis leasing. As Wells Fargo moves to new offices, look for bargain pricing on Class B office lease and subleases in the core of downtown Minneapolis.
MARKET PRICING FOR 2016
Before I close today’s presentation, I want to make a few cautionary comments about market pricing for 2016.
Market pricing is strong across all submarkets; bargains can still be found in large, high-end luxury housing. There is a strong risk of overpricing in apartment buildings, while hotels are not far behind. The expectation of low capitalization rates, i.e. sub-6%, is not sustainable. Corporate balance sheets are strong and earnings are holding, but for foreign exchange issues for multi-nationals. Unemployment is tightening, but wage growth will be slow because the US competes in a world market of lower wage levels.
MINNESOTA’S ECONOMY HIGHLIGHTS
Closer to home, here are the takeaways for Minnesota’s economy:
- Our state’s economy is growing ahead of national trends in the 16-county metropolitan area, and ever so slowly in the outstate areas.
- Minnesotans are back to work and consumer spending will continue to improve, due to increased “housing wealth,” a recovery stock market, and confidence from de-leveraging.
- Minnesota businesses will postpone spending and hiring decisions because of a lack of confidence in our current politicians and their strategies for government spending in the future.
- The Minnesota economy will continue to recover, but it will not boom until the federal government restores confidence in the marketplace on key factors such as employment, inflation and bipartisan cooperation on balanced budgets and deficit reduction policies.
And thanks to each of you for the opportunity to share my thoughts on Minnesota’s business climate for commercial and residential real estate, and the general level of profitability for small and large businesses in our state.
Sources for this article: Standards & Poor/Case-Schiller, U.S. Census Bureau, Bureau of Labor Statistics, Jones Lang LaSalle, CBRE, Colliers International, Metropolitan Council, The Builders Association of the Twin Cities, Duluth News Tribune, City of Rochester Comprehensive Annual Financial Report, Northstar/MLS, NAI Everest, MPF Research, Zillow

