Dude, Where’s My Premium? The S Corporation Premium After the Tax Cuts and Jobs Act

By: Cody J. Lindman

On December 22, 2017, President Trump signed the Tax Cuts and Jobs Act (TCJA) into law, the largest reform of the U.S. tax code since President Reagan’s Tax Reform Act of 1986.  For the purposes of this article, the most important change to the U.S. tax code is the reduction in corporate and individual income tax rates.  With respect to taxation, the U.S. tax code does not treat the income earned by C Corporations and S Corporations (Pass-Through Entities) equally.  Instead, income earned by C Corporations is taxed once at the corporate level and then again when the income is distributed to shareholders.  Contrary to C Corporations, S Corporation income flows through to a shareholder’s individual tax return, where it is then taxed at the shareholder’s individual income tax rate.  Due to the previously explained differences in taxation for C and S Corporations, a theoretical value premium or discount exists.  This premium or discount is known as the “S Corporation Premium” in the business valuation community.

Background

The theory behind the application of an S Corporation Premium is that a shareholder in an
S Corporation can make discretionary distributions (distributions beyond those necessary to pay shareholder level taxes) tax free at the corporate level.  In contrast, discretionary distributions in
C Corporations are made after corporate taxes are paid and are then subject to income tax a second time at the shareholder level.

However, income retained by the C Corporation is not subject to income tax a second time at the individual level – only those net proceeds which are distributed to the shareholders.  This is an important distinction because of the rhetoric related to C Corporation values versus S Corporation values.  It is often thought that C Corporations are “taxed twice” and S Corporations are “taxed once.”  This view is too simplistic however and results in an inaccurate assessment of the taxation differences between C and S Corporations.

In most businesses, the variable level of taxes discussed above creates a theoretical range of
S Corporation value premiums (or discounts).  Only when 100% of taxable income is distributed by the C Corporation is there true ‘double taxation’ because then there are no retained earnings.  We note however that if an S Corporation is distributing income below the shareholder tax rate, a negative S Corporation Premium (a discount) may be appropriate.  At Shenehon Company, we consider each S Corporation on a case by case basis when applying an S Corporation Premium.

The S Corporation Premium Under the Prior Tax Law

To determine the S Corporation Premium under the prior tax law, the applicable tax rates for C and S Corporations must be calculated.  In the charts on the following page, we calculated the marginal tax rates for C and S Corporations, noting that these tax rates are calculated using a specific set of assumptions and that the tax rates used may not be applicable for every business.

The chart below illustrates the calculation of the S Corporation Premium under the prior tax law using the assumptions of a 40.0% C Corporation tax rate, a 20.0% C Corporation dividend tax rate, and a 43.0% S Corporation (Pass-Through Entity) tax rate.

Therefore, the aforementioned assumptions result in an S Corporation having a theoretical value premium ranging from a high of 18.8% for an S Corporation distributing 100.00% of its taxable income to a low of -5.0% (a 5.0% discount) for an S Corporation distributing 40.00% or less of its taxable income.

The S Corporation Premium After the Tax Cuts and Jobs Act

The signing of the TCJA brought forth a myriad of changes to the U.S. tax code.  For our purposes however, one of the main changes precipitated by the TCJA was the reduction in the top marginal tax rate for C Corporations from 35.0% to 21.0%.  Additionally, the top marginal tax rate for individuals was reduced from 39.6% to 37.0%, individuals are now limited to $10,000 in state and local tax deductions, and S Corporations are able to deduct 20% of “Qualified Business Income.”  “Qualified Business Income” is vaguely defined as “…the net amount of qualified items of income, gain, deduction, and loss with respect to any qualified trade or business of the taxpayer.”  For the purposes of this article, we will consider all of the income in the following charts to be “Qualified Business Income.”

To determine the S Corporation Premium after the TCJA, the applicable tax rates for C and S Corporations must be re-calculated.  We calculated a combined marginal tax rate for
C Corporations of 27.0% and a combined marginal tax rate for S Corporations of 35.0% after the TCJA, as illustrated in the charts below.

The chart below illustrates the calculation of the S Corporation Premium after the signing of the TCJA using a 27.0% C Corporation tax rate, a 20.0% C Corporation dividend tax rate, and a 35.0% S Corporation (Pass-Through Entity) tax rate.

Therefore, the aforementioned assumptions result in an S Corporation having a theoretical value premium ranging from a high of 11.3% for an S Corporation distributing 100.00% of its taxable income to a low of -11.0% (an 11.0% discount) for an S Corporation distributing 27.00% or less of its taxable income.

Final Thoughts

Despite falling short of President Trump’s initial goal of simplifying the U.S. tax code, the TCJA was successful in narrowing the taxation gap between C Corporations and S Corporations (Pass-Through Entities), as evidenced by the previous charts illustrating the decline of the
S Corporation Premium.  For example, under the prior tax law, an S Corporation distributing 100% of its taxable income would have a theoretical S Corporation Premium of approximately 18.8%.  However, after the signing of the TCJA, the theoretical S Corporation Premium for the same entity is reduced to approximately 11.3%.  We note however that the previous charts were created using a specific set of assumptions about C and S Corporation tax rates and that the tax rates used may not be applicable to every business.  Regardless, the key takeaway from this article is that the S Corporation Premium decreased after the TCJA.

Highest and Best Use

By: Mark T. Jude

Highest and best use is a phrase used in many real estate reports.  It may be glossed over or the analysis quickly performed by the appraiser with little to no thought.  In many reports, this leads to the appraiser assuming the highest and best use of a property is the current use.  This is not always the case, and a thorough analysis should always be conducted as the market value of the property heavily relies on the property’s highest and best use.

The highest and best use of a property to be appraised provides the foundation for its market value.  The highest and best use analysis identifies the most probable competitive use to which the property can be put.  Highest and best use is defined in The Appraisal of Real Estate, 14th Edition, page 332, as “the reasonably probable use of property that results in the highest value.”  The criteria for the highest and best use analysis are: physically possible, legally permissible, financially feasible, and maximally productive.

A recent assignment that Shenehon Company worked on exemplifies the dependence of market value on the property’s highest and best use.  Shenehon Company was requested to perform an appraisal for a resort property in Honduras.  The resort is made up of eco-friendly cabins in the jungle, adjacent to a national park with both tropical jungle and mountainous landscapes to be explored.  The area is perfect for bird lovers and butterfly enthusiasts as over 500 combined species can be seen on the resort property and trail system.

To determine the highest and best use of a property as improved, the appraiser must consider whether the existing improvements should be demolished and the site should be redeveloped.  If the existing improvements will remain financially feasible and are more profitable than modifying or redeveloping the improvements, the existing use is the highest and best use.   However, modifying the existing use by conversion to an alternative use, renovation of the improvements, or alteration of the property may be necessary.

The first step in identifying the highest and best use is examining what can be physically done with the property with the existing infrastructure currently in place.  The resort is located on approximately 400 acres with considerable biological diversity.  Diverse vegetation types occur in patches on and about the resort.  Little is known about these tropical organisms, and the property would be a potential site for learning more about them and their functional interrelationships.  The improvements are in good physical condition, given their chronological age, due to regular maintenance and upkeep of the property and functionally, the improvements work well as resort property.

Next, we looked and what is legally permissible on the property.  The property is adjacent to a national park in an area the Honduran government calls the buffer zone.  The intent of this zone is to serve as a protective barrier that minimizes the impacts and pressures towards the national park that are a product of human activities and natural phenomena that are carried out within the area.  Permitted uses include tourist and eco-use (eco-resort), research, reforestation, and agriculture uses.  In the long term, we do not anticipate that there will be any zoning changes to the subject site or immediate area.

Third, we analyzed the financial feasibility of the property.  The current use will continue until the land value as vacant under its highest and best use exceeds the value of the property as improved, plus the cost of demolition.  Through our analysis, we determined that the value as improved is above the value as vacant.  Nevertheless, this is where our analysis ran into problems.  The subject resort continually operated at a loss with no positive outlook in the near future.  The existing improvements contributed value, however, the current use as a resort is not financially feasible.  Therefore, the current use is not the highest and best use.  As such, we restarted the analysis looking for another use that will comply with the first two criteria as well as being financially feasible.

During the tourist off season, the resort hosts students, researchers, classes and conferences.  The current improvements on the property include abundant lodging, multiple conference rooms, pool, spa and food service on site.  The property could offer unique advantages if it were to be converted to a biological field station/research center associated with a university.  Functionally, this would require little to no renovation.  Given the good condition of the improvements, there is no physical need for demolishing the improvements.  As well as being physically possible, a field station/research center would also comply with the zoning regulations and permitted uses as research is a permitted use for the property.

This leads us back to the financial feasibility criteria.  Investors tend to look at cash flow, income produced and return on investment when examining a property.  However, this is not necessarily the case with not for profit and/or government entities.  For these type of entities, return on investment may not be measured entirely by monetary standards.  Knowledge, education, research, academic offerings and reputation and breadth of the institution are other types of return that come to mind.  Many universities have biodiversity institutes, all with somewhat similar missions.  For example, the University of Wyoming Biodiversity Institute’s mission is to foster an understanding, appreciation and conservation of biological diversity through innovative research, education, and outreach, and by engaging a broad audience in the scientific process.   To some extent a biological field station or research center is similar to a museum, in that its operations are subsidized for the benefit of all.  However, while many parks, museums and other properties used for public benefit or educational purposes are primarily or fully subsidized by the government or educational entity, the subject property has the ability to generate some income from tourism and tuition of students enrolled in programs at the research center.  Therefore, we concluded that the subject’s economic value is directly correlated to its ability to functionally deliver the environmental and educational programs that align with the mission for many Biodiversity Institutes across the United States.  To that extent, we found that the subject improvements are well suited to that role and are both economically and functionally justified.

The single use that produces the highest value is typically the highest and best use.  When valued as a resort, the income approach and sales comparison approach produce a value well below the cost approach.  Therefore, the value to an investor looking to generate income from the property was found to be considerably lower than the replacement value of the property.  However, as an entity looking to further the research and knowledge coming from this biodiverse area, the value of the property would be considerably higher.  The question one must ask is: how much would it cost for an entity to purchase this land and replace the improvements on the property?  We found the best way to value the property is by the cost approach.  Supporting this conclusion, field stations/research centers, like museums, are rarely, if ever, traded in the open market so finding comparable transactions is extremely difficult.  Therefore, we concluded that the highest and best use for the property would be as a biodiversity field station/research and education facility.

We found that if this property were valued as a resort property, a considerable amount of value would have been overlooked.  Through our highest and best use analysis, we found a use that unlocked the true value of the property which highlights the landscape’s uniqueness while at the same time benefits society with the knowledge that can be gained from the undiscovered and undocumented species on and about the property.

Net Lease Rental Agreements: Investment Potential and Risk Factors

By: Alec D. Gooley

One of the most common lease agreements in the commercial real estate industry is a net lease.  Net leases are rental contracts between landlords and tenants that require the tenants to contribute payments toward operating expenses in addition to an annual base rental rate.  Although many office and industrial leasing contracts are net lease agreements, net leases are also popular in retail properties such as drug stores or fast food chains.  Investors are attracted to these properties because they often represent safe investments that boast steady returns over a long period of time.  When investing, it is important to consider the risk factors that can influence the overall return of a net lease investment such as landlord responsibilities, tenant retention, and capitalization rates.

Landlord Responsibilities

Investors place a considerable amount of weight on the extent of landlord responsibilities outlined in a lease when negotiating with a tenant.  The lease type impacts the annual income produced from any investment property.  The three primary net lease types are listed below:

  • Double Net (NN) – Tenant is responsible for base rent plus property taxes and insurance
  • Triple Net (NNN) – Tenant is responsible for base rent plus property taxes, insurance, common area maintenance, utilities, and operating expenses
  • Absolute NNN – Tenant is responsible for base rent plus all other operational and real estate expenses

The Absolute NNN lease provides the landlord with the least amount of risk, and is therefore the most attractive lease type for investors.

Retail Tenant Retention

Retail tenants with certified credit ratings above BBB- are in the highest demand for both private and institutional net lease investors.  The credit of the tenant leasing an investment property is directly related to the amount of risk associated with that investment.  Higher-credit tenants, such as international fast food chains, typically attract more demand from investors, which result in higher purchase prices.  Ideally, a good credit tenant will remain in a property over a longer period of time and exercise options to extend their lease after the duration of the original lease term expires.

Good credit retail tenants seek out prime real estate locations in order to maximize annual sales revenues.  Having an excellent location and visibility will help ensure tenant retention over the long-term investment period.  Locations with decreasing economic stability or low traffic counts may dissuade the tenant from extending their original lease term at the end of the original term’s life. If the tenant continues to produce high sales revenues at a specific location, the chance of lease renewal substantially increases.  

Capitalization Rates

Investors prefer net lease deals that provide adequate returns along with somewhat minimal risk.  The capitalization rate is a reliable indicator of investment security.  The capitalization rate is calculated by dividing the annual net operating income of a property into the market value of a property.

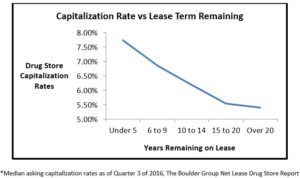
As the market value of a property increases due to demand, capitalization rates tend to decrease.  Tenants with high credit ratings, popular name brands, long-term lease agreements, and prime locations reflect the lowest capitalization rates and the highest demand.  Tenants with low risk of abandoning the property and a high probability of renewal are considered safer investments.  A high-credit tenant with 25 years remaining on their original lease term carries much less risk than a tenant with only two years remaining on their original lease term.  If tenant renewal is uncertain, the demand for that property will decrease due to the risk of vacancy.  This results in a lower market value of the property and a higher capitalization rate.  The graphic illustrates this principle:
Investment Security

Net-leased retail properties have the potential to provide a safe investment with attractive returns.  Depending on the lease terms and escalation clauses, a net lease investment property could provide stable cash flow over the course of 50 to 75 years.  Net lease investments are generally considered low risk, although the risks that do exist must be examined carefully.  The demand for net-leased properties remains high, and capitalization rates remain generally low.  High-credit tenants with over 20 years remaining on their original lease terms currently serve as the safest investments.  Tenants with lower credit or less than five years remaining on their original lease terms have increased risk and higher capitalization rates.  The net leased retail sector remains a strong market and is expected to continue growing in years to come.

Bubblewatch: A Glimpse into the Minneapolis-St. Paul Metropolitan Apartment Market

By: Robert Strachota

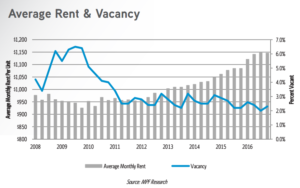
The Minneapolis-St. Paul apartment market is currently in a period of rapid expansion, with 2017 anticipated to bring more of the same.  Deliveries are expected to easily exceed 2016 figures, while rents will continue to expand, with growth rates rarely seen in the local market.  At the same time, vacancy levels are near local historic lows.  This has been going on for several years, with vacancy rates declining sharply in 2010 and 2011, followed by a steady decline through 2016.  Responding to tightening vacancy rates, rental rates have trended steadily upwards since 2011, as seen in the chart provided by Colliers.

Three major factors in the local market have pushed this expansion of the apartment market in recent years, both on the local and national level.  Demographic trends, student loan debt, and the changing makeup of families have all helped steer possible homebuyers into the apartment market, strengthening demand, pushing rental rates upward, and dictating the need for a building surge.  What follows is a closer examination of those three factors:

-An Aging Population
The generation known as “Baby Boomers”, which until recently made up the largest portion of population in the United States, has now advanced in age to between 53 and 71 years old.  For many people in this age bracket, this means a time for downsizing, as children are now entering or fully at adulthood.  Beyond the lack of a need for the physical space often sought to raise a family, houses often come with a set of chores and responsibilities that become less desirable as people age, pushing people toward apartment living.  New apartments are now being built that look to capitalize on this trend, offering amenities such as a rentable guest suite for family visits, common spaces for hobbies or activities, and connectivity to walking trails and parks.

-Student Debt Levels
Normally, the Baby Boomer generation aging into the empty nest phase of life would not have that large of an impact.  After all, we just mentioned above that Baby Boomers are no longer the largest segment of the population, that distinction now belongs to the Millennial generation, generally defined to be comprised of people between ages of 13 and 35 years old.  As the Millennial generation ages into adulthood, it would be expected that it gradually moves into the housing market, as most generations previously have.  However, this has not been the case thus far.  Many theories have been floated for this generation being slow to buy homes, from a wholesale change in values to an unwillingness to settle down.  At Shenehon, we believe that there are many factors that influence this trend, but the clearest to identify is the amount of student debt with which many college graduates are now saddled.  Recent research done by the Wall Street Journal states that the average member of the Class of 2016 graduated with $37,172 in student debt.  This means that the portion of the population (college graduates) that is best positioned for future income growth and potential home buying enters their working life in no position to save money.  Even with a high-income job directly out of college, it could take years to dig out from under the financial hole of student debt and save for a down payment, while monthly rental payments (even high payments) may be far easier to make.

-The Changing Family
According to a recent study done by John Burns Real Estate Consulting, the 2010 United States Census revealed that 32.1% of households with a child (or children) were single-parent households.  This is a figure that has risen in every census taken since 1960, when the rate of single-parent homes with children was just 8.5%.  Needless to say, high barriers into the housing market become more difficult to achieve with just one income, as opposed to two.

So, now that we have lain out some reasons we believe the apartment market to be will remain strong, let’s take a step back.  Given the boom-and-bust nature of the real estate market, it is reasonable to ask, are we on a bubble?

Here at Shenehon Compnay, we do not believe that we are, as of yet.  Besides the three factors listed above that bode well for the future of the apartment market, we point to five more common-sense indicators of a bubble:

-“House Flipping”
Raw data from Google on searches for the phrase “how to flip a house” show that public interest in learning how to flip a house, while higher than in the depths of the most recent economic recession, still remain well below the peaks recorded during the housing bubble that preceeded that recession.

-Homes for All
As of this point, we have not seen the widespread availability of lending dollars that was so noted during the subprime mortgage crisis.  Barriers to entry remain high, keeping the for-sale housing market stable and pushing more potential home buyers into renting.

-Excessive Investments
As of right now, and perhaps as a result of hard lessons learned in the previous decade, the industry has shown considerable discipline.  Thus far, development has not occurred, at least locally, in a number of small, calculated short-term bets that rely on rapidly-escalating prices.  This has kept vacancy low while allowing rapid expansion in rental rates, and has limited the amount of long-term risk absorbed by developers.

It would be easy to speculate that, based on the rapid growth seen in the apartment market in the Minneapolis-St. Paul area, we are currently on a bubble that is due to pop at any moment.  However, at Shenehon we believe that when you take a close look at the factors pushing the market to expand, sustained growth is viable for at least the next few years.  Additionally, we have not seen any of the warning signs that were apparent in the last housing bubble.  Based on these factors, we do not expect the bubble to burst anytime soon in the local apartment market.

Retooling older buildings: A popular trend for urban office space

By: Daniel L Wojcik

The retooling and repurposing of older buildings has become an increasingly popular trend in urban office markets across the country.  Companies are investing in modern office spaces as a tool to attract and retain young talent in the workforce.  A shortage of modern Class “A” office space has opened the door for expansive renovations of older, historic buildings to add new amenities and features while retaining the building’s original character and charm.  Companies are beginning to see the importance of amenities and attractive, exciting workspaces that appeal to employees.  Popular renovation amenities include: on-site parking; locker rooms; bike storage; on-site coffee shops/bars; open floor plans; and bright, collaborative spaces with lots of natural light.

A great example of this new trend toward repurposing older buildings is the Highlight Center project that was recently completed in the Northeast Minneapolis submarket by Hillcrest Development.  The Highlight Center was a major redevelopment of aging buildings that originally functioned as a light bulb factory and housed the Minneapolis Public Schools Headquarters until 2014.

The renovation included razing buildings on the site to open up space for surface parking while keeping the core buildings intact.  The process of reusing the original structures retained the character and charm of the buildings while renovations inside transformed and modernized the space.  The development team added a slew of amenities, including: bike storage and locker rooms for commuters; an on-site coffee shop and brewery; open, bright floor plans; and ample free surface parking.

Many companies that would traditionally look in the North Loop area are drawn to the Northeast Minneapolis market in search of more favorable rents.  The Highlight Center created the perfect blend between price and attractive amenities in a newly renovated, modern office building.  The new space attracted Sports Engine, a software company for managing sports leagues online, which became an anchor tenant occupying nearly 32,000 square feet of office space.  The signing of Sports Engine was a catalyst for other tech and creative companies that followed suit and helped the property reach 99% occupancy after its first year.  Sports Engine leased an additional 7,500 square feet of space approximately a year after signing the initial lease at rates nearly 11% higher than their initial signing.  Rent increases have continued as demand increased at the property, with recent signings showing strong growth from less than 12 months earlier.  Northeast Minneapolis’ close proximity to the Minneapolis Central Business District and cost-effective space options provide a compelling choice for growing companies.

For the most part, repurposing and renovating of older buildings is happening in urban neighborhoods where younger members of the labor force are choosing to live and work.  Developers’ responses to increased demand for modern workplace in urban locations will have a direct impact on asset value in the future.  The success of the Highlight Center project and interest in the Northeast Minneapolis market as a cheaper, more flexible alternative to the Central Business District or North Loop neighborhoods of Minneapolis bodes well for the area.  It will be interesting to keep an eye on the Northeast Minneapolis market to see if other renovation projects emerge, hoping to build on the success of the Highlight Center.