COVID-19 and Currency Circulation

by Emma Niemela

Across the United States, businesses are displaying signs stating, “no cash”, “credit or debit only”, or “exact change only”. These signs appeared in July, seemingly connected to COVID-19. Concerned about whether cash is becoming extinct, I investigated why these signs are appearing and what it means for the future of coins and cash in America.

At a high-level, this issue is rooted in the national reaction to COVID-19. Ever since March, people have changed their habits, making efforts to stay isolated, doing more shopping online, and using touchless payment methods. As a result of these actions, coin circulation in the United States has dramatically declined.

To clarify, there is not a shortage of currency in the United States. There is actually currently more currency in circulation than in recent years. This is illustrated in the following chart from the Federal Reserve Bank of San Francisco. The chart below documents the accelerated increase in currency issued by the Fed beginning in March of 2020, compared to the annual increase in currency circulation from 2017 through 2019.

It is important to note the above chart includes both cash and coins. Looking specifically at coins, the U.S. Mint has increased coin production from the 2019 average of 1 billion coins per month to about 1.6 billion coins in June and expects to produce about 1.65 billion coins monthly through the year end.

The Federal Reserve Bank of San Francisco also provided information on consumer payment choices in their supplemental Diary of Consumer Payment Choice (Diary) which was published in July of 2020, including data from April and May of 2020. This supplementary Diary was created to examine consumer habits during COVID-19 because of the increased demand for currency and claims that consumer payment habits were dramatically changing.

The July 2020 Diary asked participants about their cash holdings, changes in payment behavior, and cash avoidance. The Diary data supports four main conclusions: many people did not make in-person payments, most people are not avoiding cash, people are holding more cash, and online payment behavior does not appear substantially different.

The participants answered questions between April 15, 2020 and May 12, 2020. During this time period, 63% of participants reported they had not made any in-person payments since March 10, 2020. The fact that a majority of participants went a month, or perhaps two without making a single in-person payment shows the dramatic effect of initial social distancing efforts. However, it is noteworthy that only 28% of the total participants stated they were avoiding cash, a much smaller number than the 63% which had not made in-person payments.

On average, participants carried $81 in cash, an increase from $69 in 2019. The average amount of cash stored elsewhere also rose to $483, compared to $257 in 2019. This tendency to hold onto cash has contributed to the fewer coins in circulation.

The impact of business re-opening is not captured well by this data set. A majority of states began to re-open throughout May, whereas the last Diary participants responded on May 12. This limits the data’s use in predicting future habits, as the majority of businesses were closed during the study period.

Some businesses have struggled to react to the coin shortage, especially if their customers tend to make small-value payments. The 2019 Diary of Consumer Payment Choice found cash represented 49% of payments under $10 in October of 2019. Chipotle is one business falling into this category and facing a potential class action lawsuit as a result.

Plaintiffs in Pennsylvania accuse Chipotle employees of repeatedly shortchanging customers; for example, one customer paid with a $20 bill and received $4 in change instead of $4.49. The plaintiffs ask the Court to stop Chipotle from refusing to provide cash-paying customers with correct change, require Chipotle give cash-paying customers a credit toward future purchases if they lack correct change, stop Chipotle from charging consumers more for not using a credit card, and to award any other relief deemed appropriate. These accusations highlight the struggles some companies have faced while responding to the lack of coins.

It appears the shortchanging may have been a store-specific issue and result of miscommunication among employees. Chipotle‘s Chief Corporate Affairs and Food Safety Officer, Laurie Schalow responded to Delish, a website focusing on food news and recipes, with the following statement: “Chipotle’s policy is to give customers the exact change they are owed when making a cash purchase in our restaurants. If a restaurant is low on change as a result of the nationwide coin shortage, our policy is to only accept exact change or other non-cash forms of payment. Restaurants that are impacted have signage posted on the door as well as inside, and employees have been instructed to alert guests prior to ordering. We encourage customers to contact us immediately with any concerns so we can investigate and respond quickly to make things right.”

Given that coins will take some time to get back to normal circulation, it is important that businesses have a plan in place to deal with the present situation. Many companies have created plans similar to Chipotle, though there are also stories of business owners who needed coins and drove many miles to get them or organized a community coin drive.

The U.S Coin Taskforce was created to make recommendations to resolve the issue of low coin circulation. The taskforce includes members of the American Bankers Association, Independent Community Bankers of America, Credit Union Associations, Department of the Treasury (U.S. Mint), Armored Carriers Industry, Food Marketing Institute, Coin Aggregator Industry, and the Federal Reserve System. This taskforce is collaborating to strategically allocate coin inventories by simplifying the process consumers use to deposit loose change, discouraging stockpiling by individual institutions, and working with the Mint to determine necessary coin supply levels.

It does not appear that coins and cash are about to become extinct, simply that they, like all of us, have been affected by COVID-19. The U.S. Mint is running at maximum production, and many stakeholders are working together to return coin circulation to normal. The most impactful recommendation from the U.S Coin Taskforce is for consumers to bring in change to trade for cash. It will take time, but currency circulation is expected to return to normal.

The Complexity of Valuing Greenhouses

by Henry Walter

The experience of driving through the fall countryside and seeing farmers and tractors harvesting crops may soon be replaced with visions of large industrial buildings packed with fully autonomous watering, air circulation, and advanced lighting systems. Global food and technology changes have accelerated this movement, which presents unique real estate valuation challenges for appraisers.

According to the Food and Agriculture Organization of the United Nation (FAO), border closures, nationwide quarantines, and supply chain strains from the 2020 Global Pandemic have limited communities’ access to food. Additionally, the growing global population is predicted to reach 9.1 billion people by 2050, which the FAO predicts will necessitate an increase in food production of 70% globally. With supply chain disruptions, food access, and the growing global population gaining attention, entrepreneurs and investors are experimenting with ways to maximize yields while decreasing their footprint.

Conventional farming uses manpower, heavy machinery, and farm animals to till the soil in large agricultural fields. Over time, this process degrades soil, depriving it of vital nutrients and minerals required to maintain high plant yields. Technological advancements in farming can improve this process and produce higher yields, as demonstrated by agricultural output in the Netherlands. A nation that is approximately the size of Connecticut, the Netherlands is the second largest agricultural exporter, by value, in the world thanks to the use of high-tech greenhouses. In addition to producing higher yields, high-tech greenhouses are more environmental-friendly compared to conventional farming since they use a fraction of the water, fertilizers, and land. These facilities also benefit from lower labor and transportation costs because they can locate closer to metropolitan areas.

High-tech greenhouses are a newer form of real estate, which presents challenges for valuing these assets. The advanced design and technology featured in these specialized properties require a detailed and diligent analysis in order to provide a reliable and well-supported opinion of value. The appraiser must develop a thorough understanding of how these special-use buildings function in order to understand the value potential.

Once the appraiser has identified and fully researched the variety of features present in a greenhouse being appraised, he or she must then consider these unique property features when applying all applicable approaches to value. Real estate appraisers may employ three approaches to value: the cost approach, the sales comparison approach, and the income capitalization approach.

  • The income capitalization approach estimates the value of a property by analyzing its income streams and/or its potential to produce income.
  • The sales comparison approach uses the principle of substitution to determine how much a buyer would pay for a comparable property.
  • The cost approach is a valuation method estimating the price a buyer should pay for real estate based on the cost of building an equivalent building. The costs include acquisition of land and total construction costs, less economic depreciation.

Valuing high-tech greenhouses requires more due diligence from the appraiser for several reasons: the income capitalization and sales comparison approaches lack sufficient reliable market data. This is due to the fact that many facilities are owner-operated, and typically, the owner is leasing the real estate back to a related company. Rental rates in these situations do not reflect market rents, so rents must be adjusted to reflect the appropriate market rates. However, without reliable market data, it is challenging to accurately adjust rents. The application of the income capitalization approach depends on if data sufficient to support this approach is available.

An appraiser may elect to apply a sales approach, but like other approaches to value, he or she may be limited by the availability of data. Shenehon tracks the sale of specialized real estate assets such as high-tech greenhouses. For example, we have been tracking several Real Estate Investment Trusts (REITs) that are actively acquiring mechanized medical marijuana greenhouses through sale-leaseback arrangements. REITs are interested in these medical marijuana greenhouses because the supply of these property types is limited, and there is a growing demand for their use. Medical marijuana is legal in only 33 states, all of which require several permits to operate and may have state mandated limits to how many greenhouses can grow this plant. The sale-leaseback program allows medical marijuana companies to reinvest the proceeds of the sale into their operations since obtaining financing is often tricky for such companies as their product is federally prohibited from utilizing traditional financing sources.

In 2020, Industrial Innovative Properties, Inc. (IIPR) acquired several medical cannabis greenhouses, with the intention of improving and expanding capabilities and capacity of each facility through their tenant improvements. According to IIPR’s sale-leaseback program, they aim for:

  • Deals in the $5 million to $30+ million range.
  • Lease terms for 10 to 20 years on a triple net lease.
  • Initial base rent that is 10% to 16% of the total investment.
  • Rental rate annual escalations of 3% to 5%.

Their acquisitions ranged from $5.5 million with $29.5 million in tenant improvements in New Jersey to $26.8 million with $22.2 million in tenant improvements in Massachusetts. These sales provide useful data for determining value using the sales approach.

The cost approach is one of the more accurate ways to value the greenhouse due to highly specialized buildouts, but only if records of construction costs were kept. If the sworn construction statement is available, a thorough analysis of the building’s physical depreciation, as well as estimating the functional and economic obsolescence present in the property, must be completed. In cases where construction statements are unavailable, estimating the building construction costs can vary widely, resulting in significant differences in opinions of value. The plant intended to be grown in the greenhouse also has a major impact on the cost to build the structure. For example, Bayer CropScience built a 300,000 square foot automated greenhouse in Marana, Arizona for their corn-genetics research for $100 million compared to Bright Farm’s 280,000 square foot specialized greenhouse in Sellingrove, Pennsylvania designed to grow lettuce, which was built for $20 million. Different light cycles, temperatures, and carbon dioxide levels of plants require varying degrees of automation and sophistication in the buildouts.

From rural farm to city center, acrylic to polycarbonate, hydroponic to flood floors, and tomatoes to marijuana, no one high-tech greenhouse is the built the same. The limited market data and the difference in tenant improvements, purchase price, and construction costs highlight the complexity of evaluating such a unique asset. Understanding that complexity and valuing unique properties is one of things Shenehon does well.

Uniquely Priced Assets: Professional Sports Teams

by Thomas Blomgren

As the world is shuttered due to concerns over the outbreak of COVID-19, many have discussed the effects of the outbreak on the sporting world. The sudden disappearance of sports will erase at least $12 billion in revenue and hundreds of thousands of jobs in the United States, according to a recent study conducted by ESPN. Now is a good time to ask, how does this disruption in revenue impact the value of this $100 billion-dollar United States sports industry? As a business valuation firm, Shenehon Company understands the unique aspects involved in the valuation of professional sports franchises. These businesses require special treatment in order to find their accurate value.

Forbes last released their annual rankings of the 50 most valuable sports franchises as of July 2019. One trend over the recent term has been the exploding growth of team valuations. For instance, in 2012, Manchester United was the only sports team valued at over $2 billion dollars. Now, every one of the 50 franchises are valued at over $2 billion dollars. Locally, the only Minnesota franchise to make the list was the Minnesota Vikings, at $2.4 billion. Forbes does not release its propriety models to valuing sports franchises; however, we at Shenehon Company know that it is not as straight-forward as valuing other privately held companies.

The three traditional approaches to valuing a private company are: the income approach, the market approach, and the asset-based approach. Each approach has its own unique way of assessing value:

• The income approach, most often via the discounted cash flow method, is where the value is estimated based on the cash flows a business can expect to generate over its remaining useful life.

• The market approach is where the value of a business is determined by using one or more methods that compare the subject to similar businesses, business ownership interests, securities, or intangible assets that have been sold.

• The asset approach is where value is estimated based on the value of assets net of liabilities.

However, professional sports teams are more difficult to value based on traditional business valuation techniques for several reasons. First, the valuation of professional sports franchises is driven higher by the severe lack of supply. There is a limited supply of professional sports teams in the four major sporting leagues in the US and Canada (NFL, NBA, MLB, and NHL), with 123 total franchises. Therefore, sports franchises are many times treated as “trophy” assets, which means that they attract wealthy individuals in a way similar to other luxury goods. Next, the income approach is not an accurate approach to valuing sports franchises due to low expected cash flow. Most owners expect to realize their return on their investment at the time of sale, not from cash distributions on the investment during ownership. The market approach, by comparing the franchise to other previously purchased franchises, comes closest to finding the accurate fair market value. Even then, unique aspects of a sports franchise, such as the local media market, sponsorship and stadium revenue, revenue sharing mandated by collective bargaining agreements, and brand strength, must be accounted for in each valuation.

To use a recent example, the Houston Rockets were purchased by wealthy businessman, Tilman Fertitta, for $2.2 billion in 2017. According to Forbes, the Houston Rockets had approximately $296 million in revenue in 2017. This implies a revenue multiple of 7.4 for ownership of this private company, which is astronomically high. For comparison, the average entertainment company in the United States trades at a revenue multiple of 4.08, according to data compiled by NYU professor Aswath Damodaran. However, the Houston Rockets compete in a large media market and historically have been popular overseas, leading to greater franchise prestige. This makes them an attractive asset to own. Another unique franchise is the New York Yankees, who are the second most valuable sports franchise in the world at $4.6 billion. The Yankees can achieve this high valuation due to exceptional brand value, size of media market, and unique local television rights that make the franchise a “trophy” of the modern sporting world, even with operating income of $30 million.

The multiples implied in transactions of professional sports franchises highlight the unique valuation approach to these businesses. The distinct honor and prestige of owning a sports franchise serves as its own social currency, which is a distinguishing consideration when appraising these assets. Given that buyers seek benefits beyond the expectation of future cashflows throughout their ownership tenure, there is a significant difference in valuing sports franchises from valuing other businesses. These unique challenges are the dreams of the modern appraiser.

Are You Asking the Right Appraisal Question?

by John Schmick

Uniform Standards of Professional Appraisal Practice (USPAP) are the minimum appraisal requirements that guide appraisers in providing appraisal services. In Minnesota, these requirements are codified into law requiring state licensing of real estate appraisers (Chapter 82B.195). An important part of USPAP is the Scope of Work Rule which requires that the appraiser “…identify the problem to be solved; determine… the scope of work necessary to develop credible assignment results”. Identifying the problem to be solved starts with client discussions to determine what questions they have relative to their real property interests. While many assignments simply need to determine market value for business or personal decisions, in the area of litigation or transactions, asking the wrong appraisal question can nullify the entire appraisal. This is especially true with ground leases and easements where less than the whole property is burdened with lease/easement. A recent pipeline case in California illustrates the pitfall of asking the wrong appraisal question.

In 1953, a local water company entered into a pipeline easement agreement on a branch of a national railroad corridor. Terms called for the annual rent to be adjusted to market rates every ten years. For adjustment year 2013, the two sides had drastically different opinions on what market rent should be. The appraiser for the railroad opined to $862,000 annually while the appraiser for the pipeline company opined to $125,000 annually. Both appraisers used a common form of Across-the-Fence (ATF) methodology but used different sales data, different adjustments, and different rates of return. Ultimately both appraisal reports relied on the wrong appraisal question and were unreliable. A summary of the appraisals is presented in the graph below.

To understand the appraisal question, we first look back to the start of the easement in 1953. At that time, the pipeline company wanted to occupy excess space on the railroad corridor and the railroad was willing to permit such use. Excess railroad space is defined as space not currently needed for railroad operations. General valuation questions at that time were how much of the railroad’s property would be occupied and how much was the railroad’s land worth? These questions form the framework of what does the railroad give up or lose and what is the appropriate compensation?

Over time the original appraisal question can get lost as the parties try to simplify the issue. Staff for either party may not understand the significance of correctly defining the appraisal question and communicate the assignment as valuing an easement for annual rent adjustment. In this case, both appraisers defined the subject property as the easement area. The subtlety changes the framework from what does the railroad/seller lose or give up to what does the pipeline company/buyer own or control?

While the subtle change in defining the appraisal question seems harmless, the results are far reaching. By defining the subject property as the easement area, one appraiser attempted to define the larger parcel as the easement area, defining unity of ownership as the pipeline company, unity of use as a subsurface water pipeline, and contiguity as an assembled pipeline corridor. The appraiser carried this theme into the highest and best use defining economic demand for the pipeline easement was 100% because water is in high demand in California and if the current pipeline company did not provide the service, another pipeline company would. Nowhere in either appraisal did the two appraisers consider the whole railroad property, the economic profile of the corridor, or any portion of the railroad corridor outside the easement area. This is a common flaw in ATF corridor valuation appraisals.

Understanding the assignment and identifying the appraisal problem is related to the intended use of the appraisal. In this case, the intended use was to assist two parties in negotiating a fair market rent for the next adjustment period. The pipeline company owned an easement (dominant estate) that gave it the right to occupy space on the railroad’s property. The railroad retained fee simple interest in the entire corridor subject to agreements to allow others to occupy space within their ownership. Thus, the valuation question starts with identifying the railroad’s larger parcel of land from which a portion is burdened by the pipeline easement. If rent is to be paid on that portion of railroad land value captured by the easement, then the larger parcel must be defined as railroad land and not the ownership rights of the pipeline company.

By failing to understand the appraisal problem and the appraisal question, both appraisers failed to research and analyze several important relevant facts that impacted valuation. First, both appraisers acknowledge that railroad operations on the active tracks were low volume. Using estimates of railcar activity and average operating income attributed to land, per railcar per mile of track, it was discovered that current rail operations supported a land value for the center track section of less than $0.05 per square foot. This is less than one percent of typical land prices in the area. The track section occupied 34% of the corridor width.

Second, land area occupied by pipelines was 29% of the corridor width. The remaining 37% of corridor width had not attracted any economic demand in over sixty years. As a result, a total of 71% of the corridor width produced little to no income to the land. Under the ATF methodology used by both appraisers, this type of analysis is not performed.

Ultimately, using an incorrect appraisal question led to a very narrow understanding of the assignment and a land value analysis that was significantly higher than the economic profile of the railroad land. Imagine standing on the railroad property with your left foot on the pipeline easement area and your right foot on the vacant excess land. How would your appraiser answer the question: How can the land under my left foot be so valuable when the land under my right foot has no economic demand for over sixty years when it all has the same owner (railroad), is used for the same purpose (corridor), and is contiguous? Facing this and similar questions, this case settled shortly after exchanging reports, including a review report, and before scheduled arbitration. The settlement was a compromise reflecting an ongoing business relationship but favored the pipeline company.

While the case presented here may be an extreme example of using the wrong appraisal question, this issue is not limited to railroad corridors. Overlapping easements, ground leases, sale of property with existing easements, multi-parcel properties, and other situations can suffer from incorrect appraisal questions which can impact assignment results. When engaging an appraiser (real property, business, or personal property), set aside some time to thoroughly discuss the intended use, intended users, and the appropriate appraisal question to be addressed in the assignment. This will minimize unwanted surprises in the use of the appraisal at a later date.

Valuing Companies and Real Estate During COVID-19

by Madeline Strachota

Assumptions about the future are at the heart of valuation. Despite being a largely quantitative process, valuing a company or real estate relies on professional judgement and expectations about the future. The 2020 Global Pandemic is unlike any other economic crisis and poses unique valuation challenges. Sure, it has similarities to the economic impacts of the Spanish Flu, 9-11 terrorist attacks, Savings and Loan Crisis, and several other similar economic downturns. However, the Global Pandemic is widespread, impacts all industries, and lacks geographic concentration. Further, the makeup of the U.S. economy is more technologically advanced, global, and services-oriented than it was during the first half of the 20th Century. Given the novelty of this crisis, past recoveries are only modestly reliable predictors of the future.

Therefore, we consider the following data, behavior, and collective assumptions in the marketplace to understand how value is impacted since the onset of the pandemic during the first quarter of 2020:

• Some sectors are on the brink of collapse due to the 2020 Global Pandemic—specifically, hospitality, energy, retail, and transportation. While other sectors are thriving—such as supermarkets, certain online retailers, and off-sale liquor stores. The real estate associated with these industries have fared similarly. Further, sectors and property types that were considered more “recession proof” like student housing and senior housing, have not fared well during the pandemic.

• Forty percent of mergers and acquisitions (M&A) deals in progress at the beginning of the pandemic have been put on hold while only 14% of deals that were in-progress halted. Even so, M&A professionals believe that M&A activity will return to levels seen before the COVID-19 pandemic in 1-2 years (according to Alliance of Merger & Acquisition Advisors).

• As of June 2020, there was a record amount, $1.45 trillion globally, of “dry powder,” which is the money that investors have committed to private-equity funds that has not yet been spent. This is in spite of several private equity owned retailers that have filed for bankruptcy in the midst of the 2020 Global Pandemic.

• There has been a significant reduction in large real estate deal volume (deals $10 million or greater). As of July 2020, total deal volume in the U.S. was 30% lower than it was a year ago, according to Real Capital Analytics.

• Analysts report seeing 5-35% erosion in prices for commercial real estate, with residential and industrial classes being the least negatively impacted and retail, hotels, and central business district office classes being the most impacted, according to Real Capital Analytics.

These general trends cannot be applied universally. For example, in the real estate market, smaller, local-to-local transactions are occurring at generally normal paces and prices. Additionally, restrictions around travel make the due diligence process harder for institutional investors, which has caused deal slow-down and price compression in institutional grade investments. Another divergence from high-level trends are cap rates in strip mall retail, which have decreased in second quarter 2020 by 6 basis points, whereas cap rates for regional malls have increased 72 basis points. Furthermore, there is a high level of private capital reserved to pursue investments, indicating that money is likely to be deployed and may take advantage of distressed selloffs.

The impacts of the 2020 Global Pandemic must be analyzed on a case-by-case basis—not every asset is faring the same through this recession. Negative effects are temporary and the long-term economic consequences of this pandemic remain unknown. While the exact timing of a rebound is unclear, quality companies with strong fundamentals should be able to recover. Economic fundamentals were strong preceding the 2020 Global Pandemic and the negative impacts of COVID-19 could be repaired quickly if there is widespread containment of the virus. However, the longer the economic turmoil progresses, the harder it will be to achieve a V-shaped recover. The takeaway: the popularized phrase “COVID-19 discount” is a misconception, and while it may apply in certain transactions, it is not universal. A careful analysis of each valuation problem and the marketplace informs the valuation approach applied by Shenehon appraisers, especially during this unprecedented time.

Economic Forecast 2020

by Madeline Strachota

A Bet on the Economy
Just like the outcome of the World Series, if a person could predict the future of the economy, they would be a very wealthy individual. In the same way that player statistics and game record narrow down the contenders for the World Series, especially as each season progresses, it isn’t until several games into the Series, itself, that that the outcome is clear. The economy has different, albeit important, statistical indicators as to where its outcome will be in the years ahead. As with baseball, it becomes more challenging to predict outcomes many years out. And of course, in the same way that 86 years of data predicted the Red Sox would lose the World Series in 2004, there are upsets like the financial crisis in 2008 and 2009 that are difficult to predict. However, trusted financial indicators deserve methodical analysis to narrow down the list of possible economic outcomes. One such indicator of the behavior of the U.S. Treasuries yield curve.

The Yield Curve
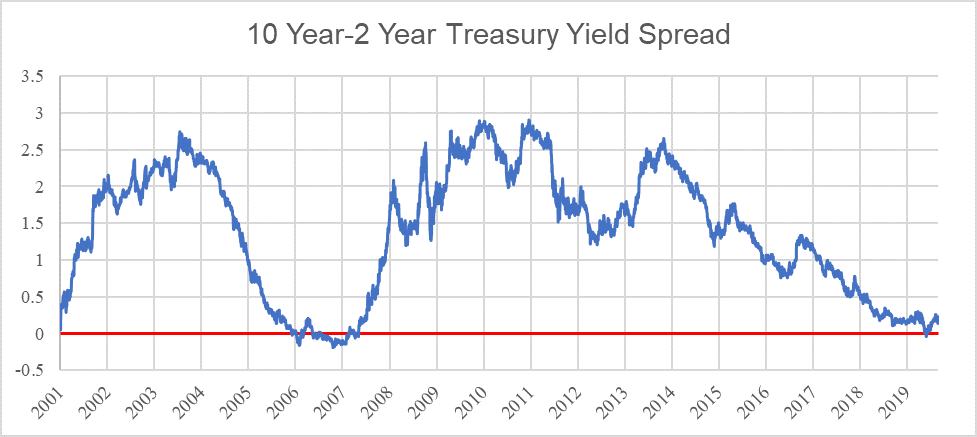
An inverted yield curve, when the yields on U.S. Treasuries with longer maturities are lower than the yields on U.S. Treasuries with shorter maturities, has preceded every recession since 1950. The spread between the yield on the 10-Year Treasury Note and the 2-Year Treasury Note is the most common threshold for determining an inversion. When the spread between the 10-Year Treasury and the 2-Year Treasury goes negative, the yield curve is considered inverted. In August 2019, the yield curve, according to the 10-Year less the 2-Year yields, inverted for the first time since the Great Recession.

The red line indicates an inversion. Data source: https://www.treasury.gov/resource-center/data-chart-center/interest-rates/

However, it is important to consider that not every yield curve inversion has been immediately succeeded by a recession. In fact, it is not accurate to expect, with certainty, a recession within the next two years, which is often the conclusion drawn after an inversion.

For example, the spread went negative in June 1998 and a recession did not occur until January 2001. Moreover, when different measures of a yield curve inversion are considered, like the 10-year Treasury to 3-month Treasury spread or the 10-year Treasury to 1-year Treasury spread, it becomes even harder to determine the timing of recessions relative to an inversion. Since June 1976, there have been five recessions, which have followed yield curve inversions within 10 to 33 months. While economic cycles are an almost certainty, it is difficult to draw conclusions that the yield curve can predict these cycles with certainty. Analysis of the data also illustrates that the extent of an inversion is not strongly correlated to the size of the recession. Lastly, with the benefit of hindsight, the Federal Reserve is taking different actions to maintain economic stability. Compared to the Federal Reserve’s response to the inversion that preceded the Great Recession, the Federal Reserve has taken more preemptive action in lowering the Federal Funds rate in 2019. The Federal Reserve lowered rates several times in 2019, whereas the yield curve inverted in early 2006, and the Federal Reserve did not start cutting the Federal Funds Rate until August 2007.

A Recession of Our Own Making
The yield curve is a beneficial economic indicator, but it is important not to overstate its meaning. Many other indicators in the economy are strong right now: Unemployment in the U.S. is the lowest it has been since 1969. S&P 500 corporate earnings are strong. Trade negotiations between the U.S. and China are positively progressing. U.S. economic participants have control of our destiny: learn from the past and make disciplined investing, borrowing, and spending decisions, and perhaps we can avoid a recession of our own making.

Market Insights: Condominiums

by Brock Boatman

They are kind of happening! So far in 2019 we have heard the announcements of some interesting and exciting new projects. TMBR, in the North Loop, would be the Twin Cities’ first high-rise timber-construction residential building, following the T3 Building’s innovative construction technique. Additionally, the top of the luxury market is being updated, with the Ryan Company’s Eleven on the River and the Gateway project’s Four Seasons-branded residences competing for the $1 million plus crowd. However, the on-again, off-again Alia project appears to have finally been shelved, showing that balancing costs, pricing, and timing with the depth of the market means that no project is a given success.

Market Insights: Opportunity Zones

by Brock Boatman

The Opportunity Zone program has not seemed to set the world on fire like some predicted. Yet. Most developers and investors appear to have the same sentiment – the tax break is nice, but really, it is just gravy; a deal still has to work on its own. But even with the release of a second round of guidance as to how the program is implemented as well as the December 31, 2019 deadline for receiving the maximum benefit, the program has not appeared to drive activity, just juicing deals that happen to qualify.

Market Insights: Household Debt

by Cody Lindman

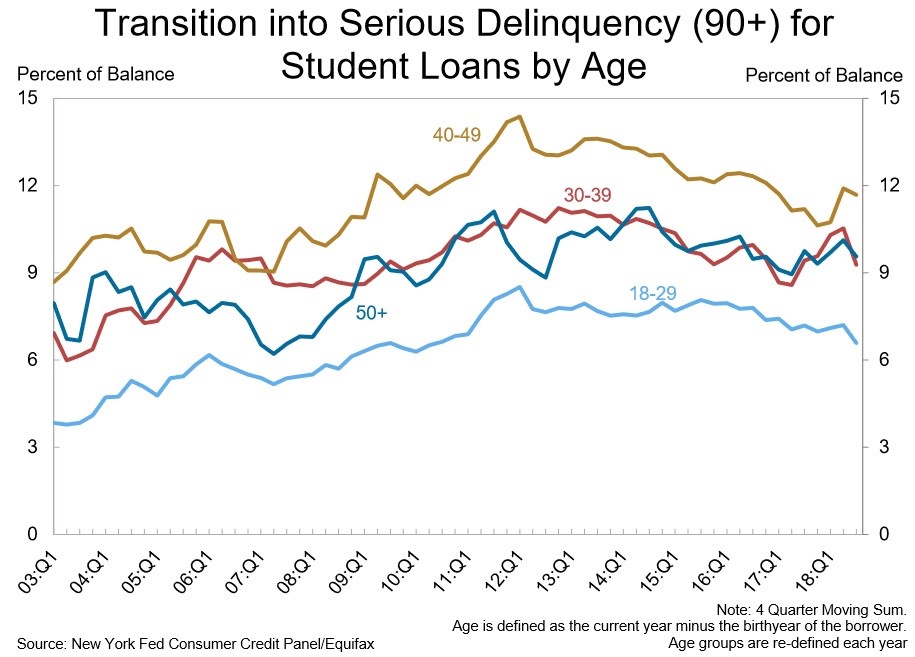
Over the past year, all forms of U.S. household debt have increased, with aggregate U.S. household debt reaching $13.95 trillion for the third quarter of 2019, an increase of $440 billion compared to a year prior. However, delinquency rates have held relatively constant over the past year. People between the ages of 40 and 49 now hold 25.1% of the total debt outstanding, the most of any age group. However, people between the ages of 18 and 29 were the most likely to be 90+ days delinquent. Unsurprisingly, mortgage debt accounts for the lion’s share of U.S. household debt, comprising approximately 67.6% of total debt outstanding. As of September 30, 2019, 4.8% of outstanding debt is in some stage of delinquency, a 0.1% increase compared to a year ago. Additionally, more than 63.5% of delinquent debt is considered 90+ days delinquent. However, on a per capita basis, household debt is still below the peak reached during the 2008 recession.

Student loan debt balances reached $1.50 trillion during the third quarter of 2019, up from $1.44 trillion a year prior. As of September 30, 2019, 10.9% of student debt balances were 90+ days delinquent or in default, a decrease of 0.6% compared to a year prior. People between the ages of 30 and 39 carry the most student debt at $490 billion or 32.8% of total student loan balances. Surprisingly, people between the ages of 40 and 49 were the most likely to be 90+ days delinquent on their student loans. One reason for this may be because this age group carries the largest amount of debt in aggregate and is prioritizing repaying mortgage debt and auto loan debt rather than student loan debt. This would be logical because there are more immediate negative consequences if one fails to repay mortgage debt (foreclosure) and auto loan debt (repossession) as compared to student loan debt.

Market Insights: Apartment Market

by H. Ellis Beck

Usually, holidays don’t have much impact on the health of a market, but when analyzing the Twin Cities apartment market, my thoughts turn to Groundhog Day. Yet again, the local apartment market had an extremely solid year, adding inventory and successfully leasing up that new space while rental rates grew. However, as in recent years, signs suggest that this run of growth in the market may be nearing its end point, as local employment growth and rental rate growth slow. Once again, the local apartment market had an extremely solid year, adding inventory and successfully leasing up that new space while rental rates grew. However, as in recent years, signs suggest that this run of growth in the market may be nearing its end point, as local employment growth and rental rate growth slow.

The Minneapolis-St. Paul apartment market has been consistently strong over the past decade, with vacancy rates remaining below 5% in the market over the past nine years. This has spurred a period of significant development that has continued through 2019. This should span into 2020, with more than 10,000 units expected to be delivered. This rise in apartment stock has not been spread throughout the metro, but has been concentrated in a few key areas, namely Downtown Minneapolis, in and around the University of Minnesota campus, and several clusters of suburban areas, primarily located near major highway intersections.

Through all this, capitalization rates have continued to compress, as out-of-state buyers look to get into an extremely tight market. At the same time, average prices have risen to over $130,000 per unit. With the large amount of inventory expected to come online in 2020, this is a trend we anticipate continuing.


Stop me if you have heard this, but it seems like we are headed for another year of a growing apartment market. Still, this can not and will not last forever, so keep an eye on key indicators such as local employment growth and rental rate growth to predict when this will finally end.